Achieving synthesis via a custom graphical notation
There are many excellent diagramming applications available, some of which are even free. So why did I devote my time to creating my own? I enjoy coding, I enjoy a good challenge, but my main motivation, in this case, was to have a feature that meant a lot to me: the ability to define custom graphical notations.
A graphical notation is a set of symbol and line templates used to express a software’s logical design by producing diagrams.
The most widely used notations are either general purpose (for example, UML) or barely confine themselves to a generic domain (example: BPMN). I learned a lot from studying and using such notations, but I also realised that custom graphical notations dedicated to a specific domain can produce more succinct diagrams.
The clarity of a diagram is determined by the quality of the logical design being expressed and the diagram designer’s ability to manifest such quality. The latter, on the other hand, is influenced by the expressive power of the chosen graphical notation.
Most importantly, clearer diagrams can have an impact on the logical design itself.
That is because creating quality software necessitates iterative processes: you do not get it all done in one step, and you almost never get it completely right the first time.
After capturing the logical design of the software I was developing in a diagram, I frequently ended up changing the design itself, drawing another diagram, and so on, until it was clear to my mind, through my eyes, that the original vision that began the project had materialized in good form into this reality.
A concrete example
When I started ASL, I promised to provide concrete examples from my applications for the abstract topics that I would be covering and I will not break that promise today.
Today’s example is a custom graphical notation I created to help me capture the logical design of machine learning applications as expressed by the ML.Net technology I use when implementing them.
For lack of a better name, I will call my notation MLSN: Machine Learning Simple Notation.
Introducing MLSN
At the time of writing, MLSN is made of few symbols and directional labelled relationships.
The notation is inspired by the initial intent of capturing the basics of machine learning as synthetically as possible, so the following examples will do just that: summarize and graphically represent the most important concepts of the machine learning paradigm, according to the ML.Net implementation.
MLSN is currently made of 11 symbols, grouped as follows:
- Core
– Algorithm
– Model - Data
– Training Data
– Features Data
– Raw Data
– Evaluation Data
– Transformer - Output
– Category
– Prediction - Quality Control
– Evaluator
– Metrics
The following diagram lists an example of each symbol:
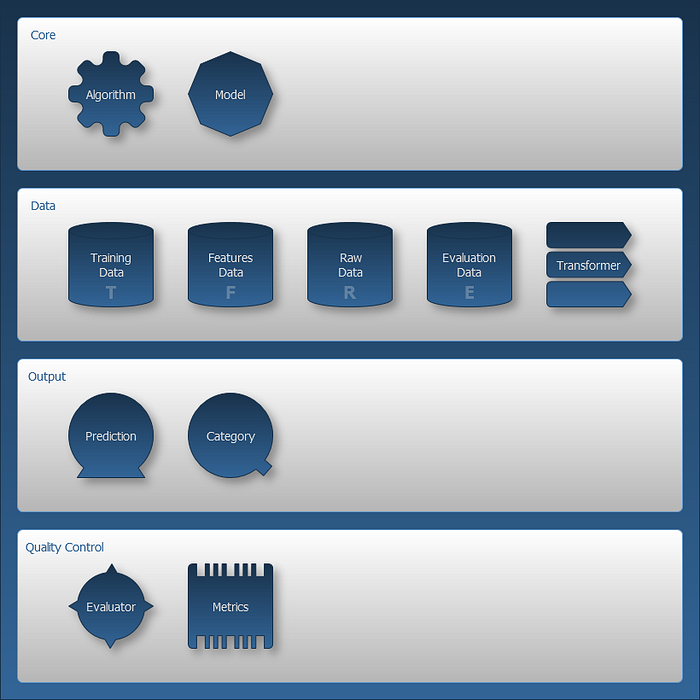
The diagram above was produced using Symbolizer. The symbol shading is merely an aesthetic option offered by Symbolizer as a form of highlighting, and it doesn’t imply any semantic.
Directional labelled relationships
Symbolizer allows all kinds of lines to be drawn to represent a relationship between two symbols, but at the moment MLSN does not represent the semantic of a relationship using a specific line pattern; instead, it relies on labels. Relationships are represented by continuous lines that may have tipped arrows to indicate the direction of the flow, but again, the label of the line expresses the nature of the relationship, which I believe is a more readable solution, at least at this stage of the notation.
Applying MLSN to ML
So what if we use this notation to describe what machine learning is about? That has to be very simple and hopefully very expressive and readable.
Let’s do it in just three steps:
- Machine learning basics
- Data transformation
- Model evaluation
Machine learning basics according to MLSN
The basics of machine learning start with the creation of a model as described by the following diagram:
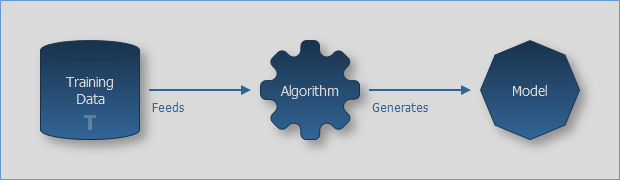
The diagram tells us that we feed Training Data to an Algorithm that in turn generates a Model.
The model can then be used to obtain some output. MLSN recognizes two types of output each described by the following two diagrams:
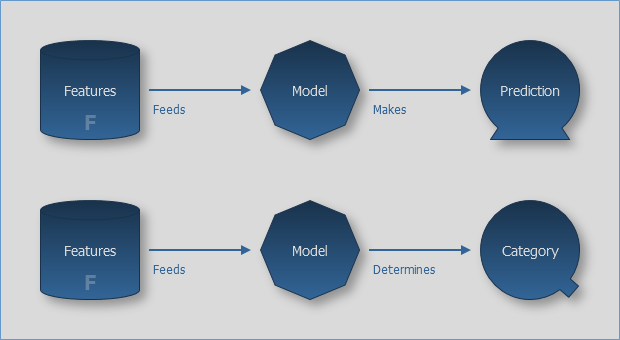
The two diagrams above share the same first part in which they tell has that we have to feed Features Data to the Model to get something out of it. What we get depends on the purpose of the Model and, according to MLSN, can be one of two things a Prediction or a Category.
This is how shortly MLSN can tell us what machine learning is about. And using a few other symbols it can also tell us a bit more about a typical machine learning eco-system.
Data transformation according to MLSN
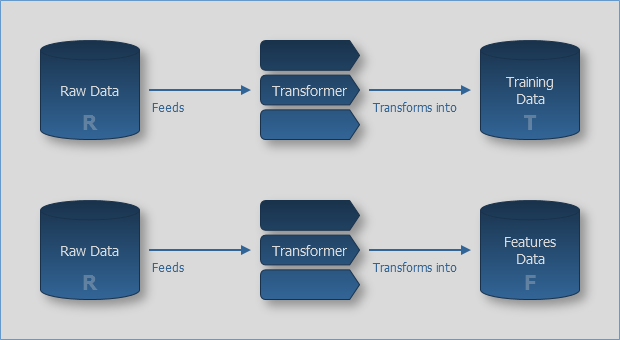
The two diagrams above are almost identical, the only difference between the two is made by the third symbols on the right. What the diagram is telling us is that sometimes we receive Raw Data instead of Training Data and we cannot feed it to the Algorithm straight-away: we need to transform it first, hence the Transformer symbol.
Very similarly we might receive Raw Data instead of Features Data and, once again, we might need to transform it into Features Data before feeding the Model.
Data transformation is a frequent necessity to eliminate duplicates (whenever it makes sense), change data format, and for any other requirement emerging from the specific application.
With the simple notation above MLSN allows us to clearly express this phase of the machine learning workflow.
Model evaluation according to MLSN
The last symbols available in MLSN that we haven’t used yet, help us to focus on the answer to an important question: how good is the current model? Which in other words is the same as to ask how correct are the predictions (or classifications) that the model makes (or determines)?
The following diagram describes how we can find an answer to such question:
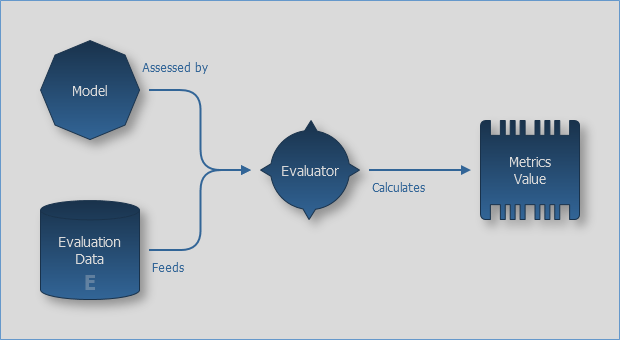
The Model is assessed by a component called Evaluator that also receives as input Evaluation Data, as the fourth type of data recognised by MLSN. The evaluator calculates a measure of how good the model is and expresses it in terms of a metric value depending on the Metrics associated with the chosen Algorithm which generated the Model (as shown in the previous diagrams).
This ends the description of MLSN and the summarizing of what machine learning is about according to MLSN and the ML.Net implementation.
How to use MLSN
The example provided is somewhat self-referential in relation to the considered domain: MLSN expressing the most fundamental concepts of the machine learning eco-system. That is exactly how I came up with this graphical notation. However, the use of the notation itself can become very specific to the project is applied to by replacing the self-referential labels of the symbols with labels that relate to the domain of the project.
I also find extremely convenient to mix-and-match MLSN with other notations, using MLSN for the part which is related to the machine learning domain and using whatever other notation to produce the diagram I want.
Conclusion
In this ASL episode I used MLSN as a small example to demonstrate how custom graphical notations can greatly aid in capturing a solution’s logical design and triggering beneficial evolution of the design itself.
I hope it gave you a sense of the strategical importance of diagrams in the context of software production.
All for now.